Data Assessment Dashboard
Use the Data Assessment Dashboard to apply filters to cull the data set and generate a breakdown of data for analysis and review. The Data Assessment Dashboard is inactive until you process any data. To verify that this feature is enabled, refer to Enable Data Assessment Dashboard .
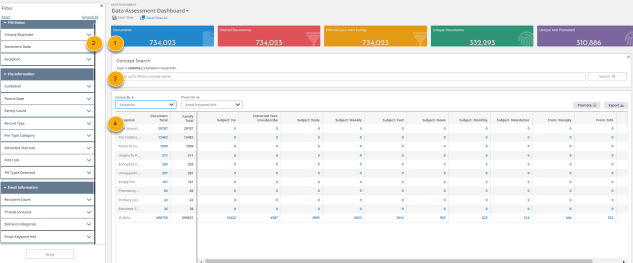
The following figure shows an example Data Assessment Dashboard.
-
. Summary information at the top of the page includes the following information.
-
. Total number of documents in the project.
-
. Number of filtered documents without family. Hover over it to view the percentage of filtered documents without family within the total documents.
-
. Number of filtered documents with family. Hover over it to view the percentage of filtered documents with family within the total documents.
-
. Number of unique documents within the filtered documents with family. Hover over it to view the percentage of unique documents within the filtered documents with family.
-
. Number of documents not promoted within the unique documents. Hover over it to view the percentage of documents not promoted within the unique documents.
Click a summary card to view the list of documents in the Inspect page.
-
-
. When you do not select any options on the pane and do not apply any concept search results, the totals in the dashboard reflect all the data. You can modify the dashboard information using the , , and options on the pane. For example, when you select the checkbox in >, the summary information and pivot table show totals for only promoted data.
-
. Conceptual search matches occur on the ideas expressed by the words you provide. Use to find and identify words that are conceptually similar to words you supply. allows you to enter up to 15 concept words to find related concepts within the document set. You can then apply the concept search results to the Data Assessment Dashboard.
In the Concepts table, each word shows a Relevance bar that indicates the relevancy of the concept matches.
The concept words in the Suggested Concepts table occur at the highest frequencies within the concept search hits. This table shows the top 25 results. Each word shows one of the Frequency indicators shown below. Frequency indicates the number of documents that hit on a specific word. The Frequency displayed is relative to the maximum of 25 results populated in the table.
-
High

-
Medium

-
Low

-
-
. You can view the detail information about the filtered documents in the pivot table. Click a cell in the table to view the documents in the Inspect page.
For more details on how to filter your processed data using this dashboard, refer to Use the Data Assessment Dashboard.